계층적 군집 Hierarchical Clustering
: 데이터를 계층적으로 연결해가면서 가까운 군집끼리 군집을 구성해 가는 알고리즘이다
기초 라이브러리
import numpy as np
import matplotlib.pyplot as plt
import pandas as pd
기초 데이터 df
df = pd.read_csv('../data/Mall_Customers.csv')
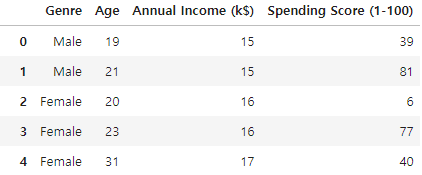
df.head()
1. nan 확인
df.isna().sum()
>>>
    CustomerID                0
    Genre                     0
    Age                       0
    Annual Income (k$)        0
    Spending Score (1-100)    0
    dtype: int64
2. y 값이 없으므로 X 값만 구하기
X = df.loc[ : , 'Genre' : ]
X.head()
3. X 데이터에 오브젝트 컬럼 찾아서 숫자로 바꿔주기
X['Genre'].nunique()
# 2
from sklearn.preprocessing import LabelEncoder
encoder = LabelEncoder()
X['Genre'] = encoder.fit_transform(X['Genre'])
X['Genre'].unique()
# array([1, 0])
4. Dendrogram 을 그리고, 최적의 클러스터 갯수를 찾는다
- Hierarchical Clustering 사용 라이브러리 임폴트
import scipy.cluster.hierarchy as sch- 댄드로그램 타이틀과 x, y 라벨 붙혀서 깔끔하게 만들고 저장까지 해본다
- sch.dendrogram(sch.linkage(X, method = ' * ') 사용 한다
-- method : single, complete, average, centroid, ward linkage 방식이 존재한다
plt.figure(figsize=(15,10))
sch.dendrogram(sch.linkage(X, method = 'ward') )
plt.title('Dendrogram')
plt.xlabel('Customers')
plt.ylabel('Distances')
plt.savefig('dendrogram.png')
plt.show()
- Distances 가 200에서 자르는게 가장 가까운 것끼리 모인 것 같다고 판단되어 5개의 군집으로 설정한다

5. 병합적 군집으로 처리 한다
- AgglomerativeClustering 라이브러리 임폴트
from sklearn.cluster import AgglomerativeClustering- 인공지능을 만들어 군집을 형성하고 기초 데이터셋에 'Group'이라는 컬럼명으로 추가한다
- AgglomerativeClustering(n_clusters=*) 사용 n_clusters=* 별은 내가 댄드로그램을 보고 설정한 군집의 수를 적으면 된다
hc = AgglomerativeClustering(n_clusters=5)
y_pred = hc.fit_predict(X)
y_pred
>>>
    array([4, 3, 4, 3, 4, 3, 4, 3, 4, 3, 4, 3, 4, 3, 4, 3, 4, 3, 4, 3, 4, 3,
           4, 3, 4, 3, 4, 0, 4, 3, 4, 3, 4, 3, 4, 3, 4, 3, 4, 3, 4, 3, 4, 0,
           4, 0, 0, 0, 0, 0, 0, 0, 0, 0, 0, 0, 0, 0, 0, 0, 0, 0, 0, 0, 0, 0,
           0, 0, 0, 0, 0, 0, 0, 0, 0, 0, 0, 0, 0, 0, 0, 0, 0, 0, 0, 0, 0, 0,
           0, 0, 0, 0, 0, 0, 0, 0, 0, 0, 0, 0, 0, 0, 0, 0, 0, 0, 0, 0, 0, 0,
           0, 0, 0, 0, 0, 0, 0, 0, 0, 0, 0, 0, 0, 2, 0, 2, 1, 2, 1, 2, 1, 2,
           0, 2, 1, 2, 1, 2, 1, 2, 1, 2, 0, 2, 1, 2, 1, 2, 1, 2, 1, 2, 1, 2,
           1, 2, 1, 2, 1, 2, 1, 2, 1, 2, 1, 2, 1, 2, 1, 2, 1, 2, 1, 2, 1, 2,
           1, 2, 1, 2, 1, 2, 1, 2, 1, 2, 1, 2, 1, 2, 1, 2, 1, 2, 1, 2, 1, 2,
           1, 2], dtype=int64)
df['Group'] = y_pred
df.head()
6. 원하는 그룹 정보만 가져올 수 있다
df.loc[df['Group'] == 0, ]


