문제 상황
: 스트림릿에서 Seaborn의 pairplot 코드를 작성해도 웹 화면에 안보인다
    corr_column_list =  ['Age', 'Annual Salary', 'Credit Card Debt', 'Net Worth', 'Car Purchase Amount']
    selected_columns = st.multiselect('컬럼을 선택하세요', options=corr_column_list)

    fig = plt.figure()
    sb.pairplot(data=df, vars=selected_columns)
    st.pyplot(fig)
문제 원인
: 코드 작성의 문제
: Stramlit 공식 홈페이지에서도 확인할 수 있었다
(https://discuss.streamlit.io/t/how-to-display-matplotlib-graphs-in-streamlit-application/35383)
    # fig 변수를 따로 주지 않고 fig = plt.figure()
    # 시본 페어플롯 코드에 직접 변수 설정하면 된다
    fig = sb.pairplot(data=df, vars=selected_columns)
    st.pyplot(fig)
문제 해결
: 코드를 변경해서 유저가 선택하면 상관계수와 함께 나오는 페어플롯을 만들었다
    # 상관관계 분석
    st.subheader('상관관계 분석')
    st.text('컬럼들을 2개 이상 선택하면, 컬럼들의 상관계수를 보여드립니다.')

    corr_column_list =  ['Age', 'Annual Salary', 'Credit Card Debt', 'Net Worth', 'Car Purchase Amount']
    selected_columns = st.multiselect('컬럼을 선택하세요', options=corr_column_list)

    # 두개 이상 선택 했을떄와 그렇지 않을때로 개발
    if len(selected_columns) >= 2 :
        # 1. 시본의 페어플롯을 그린다.
        fig = sb.pairplot(data=df, vars=selected_columns)
        st.pyplot(fig)

        # 2. 상관계수 보여준다.
        st.dataframe(df[selected_columns].corr())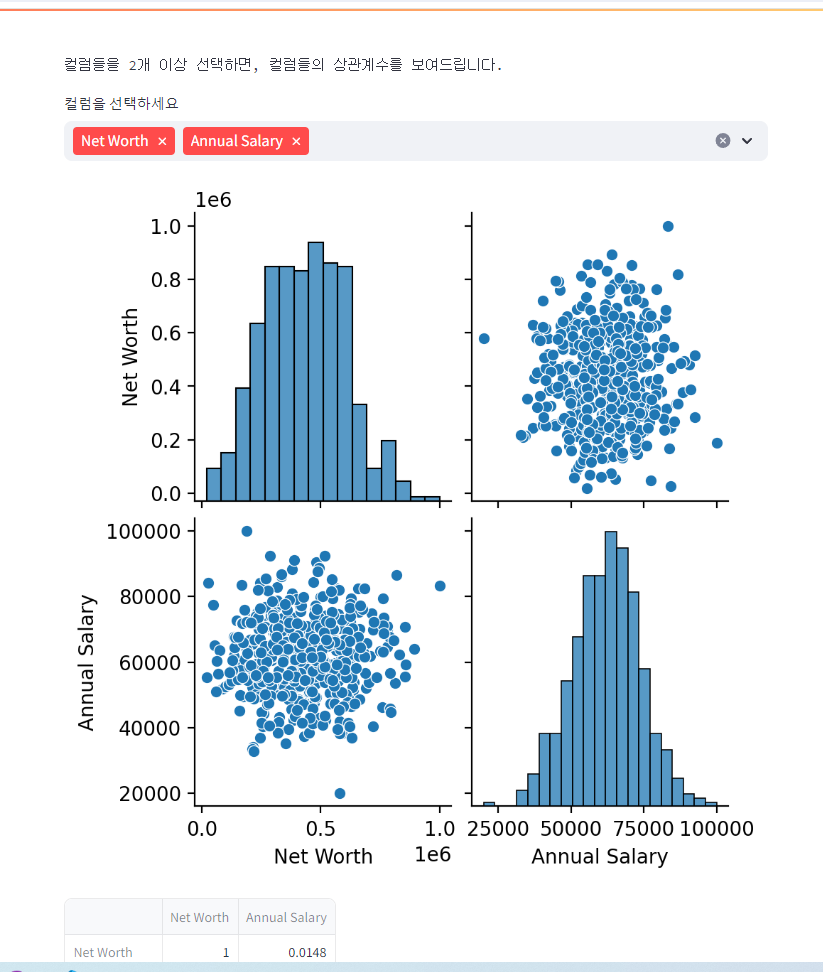
'DASHBOARD APP 개발 > Streamlit Library' 카테고리의 다른 글
| [Streamlit] st.sidebar() 를 option_menu()사용해서 꾸미기 (0) | 2024.05.03 |
|---|---|
| [Python] Streamlit 유저한테 숫자, 문자, 시간, 색 입력 받기 (0) | 2024.04.25 |
| [Python] Streamlit 이미지, 동영상, 오디오 파일 화면에 보여주기 _ Image(), video(), audio(), open() (0) | 2024.04.25 |
| [Python] Streamlit UI 함수들 _ selectbox(), multiselect(), slider(), info(), expander() (0) | 2024.04.25 |
| [Python] Streamlit UI 함수들 _ button(), radio(), checkbox() (0) | 2024.04.25 |


